Twenty-one Years of USNWR

Updated with rankings from US News America's Best Graduate Schools 2010:


Green marks moves into the Top 10, red marks moves out. Turquoise indicates ties for 9th or 10th place that forced more than ten schools into the "Top 10." For those who wonder: The moniker "Top 14" stems from the observation that only fourteen schools have ever appeared in the Top 10 spots of the USNWR law school rankings. Also, since 1990 only these fourteen schools have appeared in the Top 14 spots.

A few things of note:

  • Of the Top 6 schools, only two (Chicago and NYU) have ever fallen out of the Top 6. NYU was bumped to 7th by Michigan in 1991 and 1992; Chicago was bumped to 7th by Berkeley in 2008.

  • Michigan is the only school outside the Top 6 which was in the Top 10 every single year.

  • Virginia fell outside the Top 10 only once (to 14th place in 1994).

  • For the first time in 2009, the Top 10 became the Top 12, due to ties for 10th place. In eight of the eleven years before that, the Top 10 was the Top 11, due to ties for 9th or 10th.

  • Penn holds the record for most moves in and out of the Top 10, but has spent more years in (16) than out (5).

  • Northwestern appeared in the Top 10 four times, once in a tie for 10th.

  • Cornell appeared in the Top 10 three times and only in ties for 10th place.

  • Georgetown appeared in the Top 10 only once (1993), and has held fast in 14th place for twelve of the last thirteen years.

  • Texas and UCLA were in the first "Top 14" in 1987, but were bumped by Cornell and Northwestern in 1990, never to return.

Schools outside the Top 6, ranked by number of times in the Top 10:
Michigan     |||||||||||||||||||||
Virginia ||||||||||||||||||||
Pennsylvania ||||||||||||||||
Duke |||||||||||||||
Berkeley ||||||||||||||
Northwestern ||||
Cornell |||
Georgetown |

Job Market Risk Index

(Cross-posted to MoneyLaw)

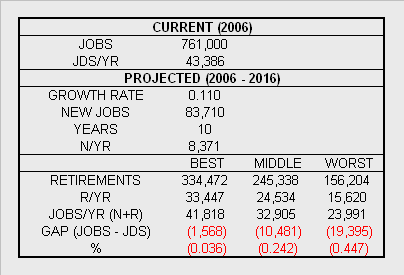
It's not news that the job market is tough for new lawyers right now. But how bad is it? And how bad will it get? Lets look at some recent figures. According to the U.S. Department of Labor, Bureau of Labor Statistics, there were 761,000 lawyers working in America in 2006. The BLS projects that this number will grow by 11% over the decade from 2006 to 2016. That means that we should have about 83,710 new jobs for attorneys by 2016, or an average of about 8,371 new jobs per year.

In order to guess at the overall employment outlook for new lawyers, we have to guess at the number that might retire as well. Retirements should, in theory at least, create more jobs for new attorneys. The ratio won't be one to one, because law firms hire and fire new associates based on overall market conditions, not based on the number of partners retiring or senior associates promoted to partner each year. But to keep this simple we'll just assume that one retirement equals more or less one opening.

So lets look at some history (PDF). The first table here shows the number of JDs awarded by ABA approved law schools for the years 1966 through 1995:


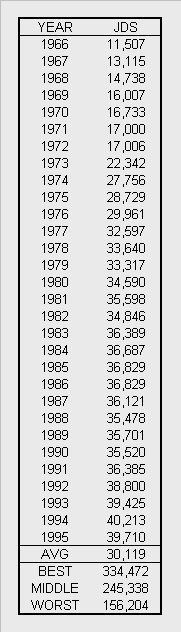
It seems reasonable to assume that lawyers who graduated somewhere in this time frame will make up most of those retiring over the 2006 - 2016 decade. Those called to the bar in 1966 had worked for 40 years at the start of the period, and those admitted in 1986 had worked for 20. The numbers marked as BEST and WORST seem like the largest and smallest numbers of attorneys that might retire in the near future. The BEST case assumes that retirees come mainly from the largest cohort of those admitted from 1986 to 1995. The WORST case assumes that retirees are mainly those from the 1966 to 1975 period. The MIDDLE case is the average of these two.

The table below shows the results of adding estimated retirees and average new jobs to figure BEST, MIDDLE, and WORST cases for the number of jobs per year available to new attorneys. From these figures, it seems that in the best case we might have jobs for 96% of new JDs over the next decade. But the middle or worst cases would leave 25 - 45% of new lawyers out of work each year.


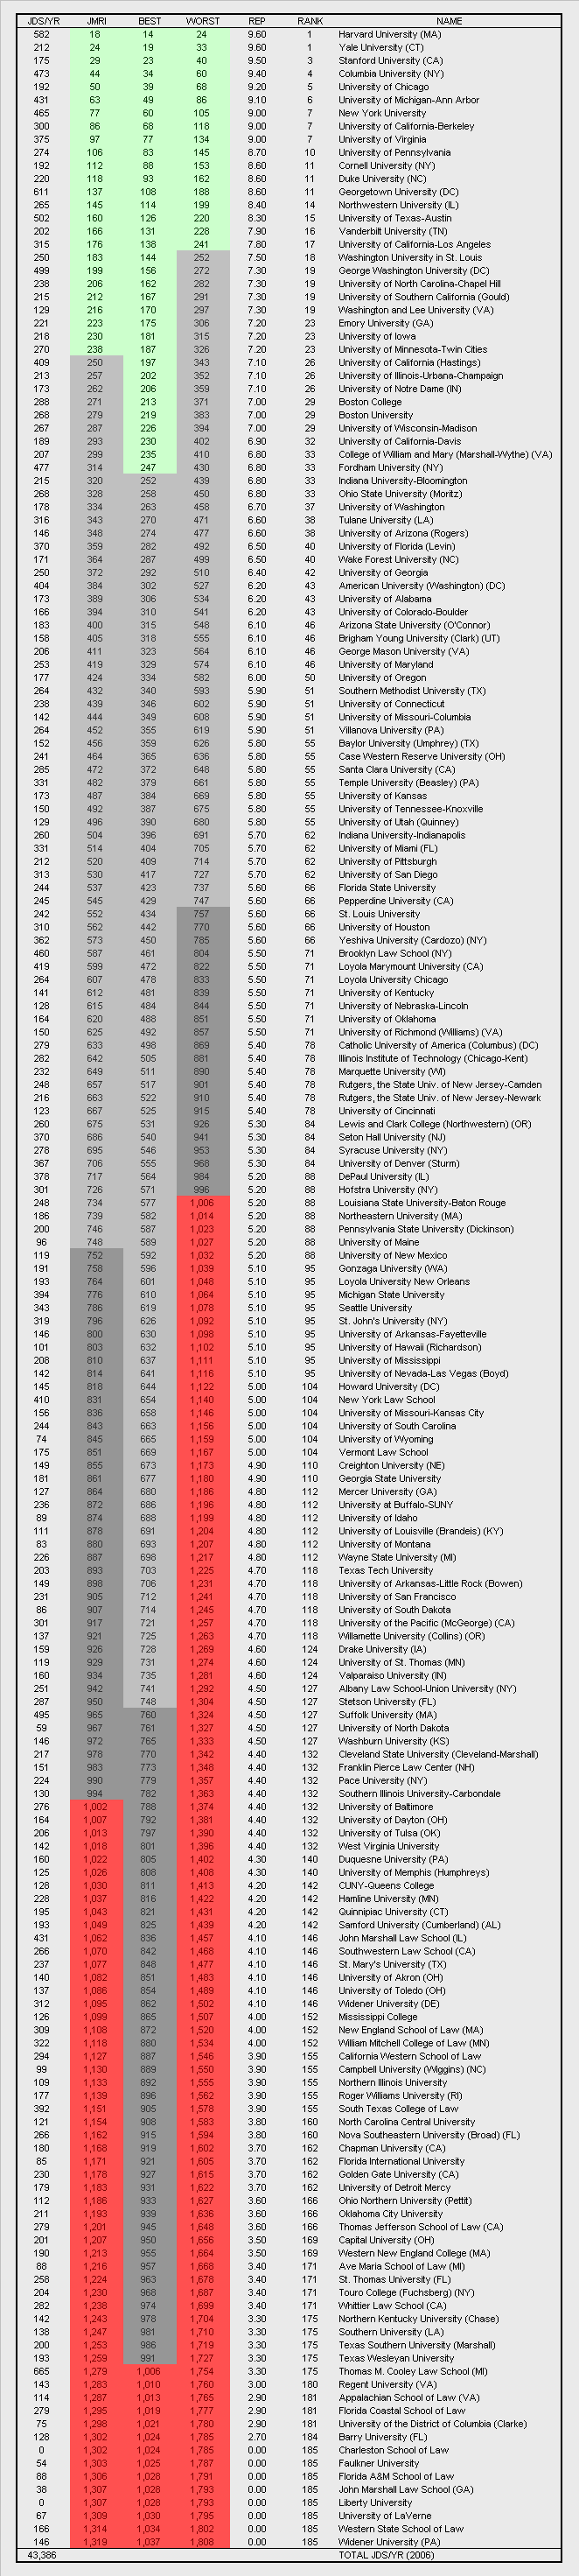
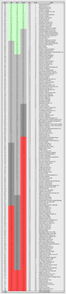
The projected number of new JDS per year comes from the next table, which shows the number of degrees awarded in 2006 by all ABA approved law schools. This table also shows the JMRI score for each school. Schools are sorted in descending order of US News Combined Reputation Score. The JMRI is a measure of the proportion of the total openings for new lawyers each year that could be filled by a given school's graduates and the graduates of all schools higher up in the listing. For example, the formula for Stanford is:

JMRI = JDS(Stanford + Yale + Harvard) / JOBS(MIDDLE) * 1,000

So the classes of Stanford and the two schools above it could fill 2.9% of available jobs each year -- as projected in the MIDDLE case -- resulting in a JMRI score of 29. The BEST and WORST columns use a similar formula but give alternative measures for those cases. A JMRI score of 1,000 or higher may be cause for some concern.


This is only a crude metric because of course the job market doesn't fill from top to bottom in strict reputation score order. Law firms tend to hire from a certain number of national schools and then from local schools in their region -- not indiscriminately from all schools in the country. Larger firms tend to hire more graduates from national schools, and smaller firms do more of their hiring locally. Also, students at a "riskier" school with very high grades and prior work experience in high demand may have much better prospects than graduates with no such assets at a less "risky" school. So the JMRI score is just a relative estimate of the overall risk of not finding a job for graduates of different schools -- not an absolute predictor of the outlook for lawyers from any one school.

Of course, the cases all assume job growth for new lawyers will at least match BLS projections. Given the current rumors of mass layoffs, mergers, and even some firms folding, that may or may not happen. The new JD figures per year also do not include graduates from recently approved schools at Charlotte, Elon, and Drexel ... or UC Irvine ... or the ten new law schools now under proposal or development. They also include no graduates from the Peking University Law School, which according to Bill Henderson also has plans to seek ABA accreditation.

Law School Clusters

(Cross-posted to MoneyLaw)

After pointing out the more severe flaws in the Legal Education Value Added Rankings, I spent some time reading Linda Wightman's LSAC National Longitudinal Bar Passage Study (based on a cohort of students who started law school in 1991). With respect to "valued added" concepts in legal education, one conclusion of this study stands out: LSAT scores and law school GPA have the strongest predictive value for bar passage rates, but results for students with the same LSAT and LGPA differ significantly between certain of the six "clusters" of schools which the study identified.

Wightman identified one group of schools ("Cluster 3") in which students having the same LSAT score and LGPA seemed to have higher success in passing the bar relative to several other clusters. And she found the greatest gap between the success of students with the same LSAT and LGPA who attend schools in Cluster 6 vs. those in Cluster 3. There were lesser gaps in outcomes for schools in Clusters 2 and 5 compared with those in Cluster 3. And two of the clusters (1 and 4) had no significant difference in success rates from Cluster 3 (also an interesting conclusion). Finally, the differences were greatest between students attending schools in different clusters when those students had a lower LSAT score and law school GPA.

Wightman points out that the study does not establish any causal connection between attending schools in different clusters. And it is a little hard to identify example schools from the various clusters, not the least because for most schools the values of the variables involved in the study have shifted greatly in the past seventeen years. But regardless what schools made up what clusters in 1990, Wightman's basic method remains compelling -- finding significant variables on which law schools tend to naturally cluster, and then examining how outcomes differ between those clusters.

I'm trying now to understand the math behind the clustering procedure and to repeat the process using current data, to see what clusters might emerge today. As a first step in that process, I composed data from the ABA Official Guide to Law Schools (2008 Edition) to replicate the variables Wightman used in her 1993 study: Clustering Law Schools Using Variables That Describe Cost, Selectivity, and Student Body Characteristics (PDF). I've only gotten as far as calculating summary statistics and Z-scores, but those results seemed striking enough to merit posting on their own (*). The variables Wightman used for clustering and which I have recalculated are:

ENROLL FT: Full-time enrollment
S/F RATIO: Student to faculty ratio
MIN %: Percent minority enrollment (first-year)
ACC %: Acceptance rate (total)
LSAT: Median LSAT for entering full-time students
UGPA: Median undergraduate GPA for entering full-time students
TUITION: Full-time resident tuition and fees


I have not done any hypothesis tests to determine which changes are statistically significant, but just eyeballing the data seems to reveal some notable shifts.

Enrollment: The mean and standard deviation have both dropped, suggesting a convergence of all schools toward lower full-time enrollment.

Faculty: The S/F ratio has dropped by a good bit, but the standard deviation has widened. Schools seem to be employing noticeably more faculty overall, but they may also have scattered quite a bit in the magnitude and direction of change on this measure.

Minorities: The mean percentage of minority enrollment has increased from 16% to 21%, but the standard deviation is about the same -- basically the entire curve took a step to the right. One question we may have is which minorities are counted for the purpose of "minority enrollment." I am not sure whether Wightman's figures only include certain minorities, or if she used the Total Minority numbers from the ABA as I did (and as I assumed she did).

Selectivity: The overall distribution of acceptance rates has hardly changed at all, but academic index parameters have changed a lot. Schools as a whole appear to have become much more selective on GPA and much less selective on LSAT scores. The Wightman study uses LSAT scores from the old scale, and I could not find a score percentile table from 1991 anywhere online (if anyone out there happens to have a copy of one, please let me know). I made a rough attempt to equate the scoring scales, from which I guessed that a 36 on the old scale was around the 85th percentile. The current mean of 158 falls at the 75th percentile. Median GPAs, meanwhile, have shifted upward more than 0.20, but the standard deviation has stayed about the same. Here again, it looks like the whole curve just shifted right by quite a bit (grade inflation, anyone ... ?).

Cost: The standard deviation for total tuition and fees today is larger than the mean was seventeen years ago -- enough said.

(*) As Wightman did, I excluded a handful of schools from these statistics: 1) The three ABA approved schools in Puerto Rico; and 2) The "one law school that enrolls part-time students almost exclusively."

Take Action to Fix Problems With CCRAA

If you haven't done so yet, check out the email campaign at IBRinfo.org. They're collecting letters addressed to the Department of Education, asking them to fix some issues with the proposed rules on Income Based Repayment and Public Service Loan Forgiveness. The main problems as the rules stand now are: 1) People can't tell whether their jobs will qualify under the public service rules until after they've worked in them for a decade; and 2) The only way for married borrowers to avoid a severe "marriage penalty" is to elect "married filing separately" status on their tax returns, which knocks them out of dozens of important deductions.